
The Afternoon I Told Finance We Had No Idea If AI Was Worth It
We were eight months into production with an AI-powered anomaly detection system that flagged unusual patterns in customer usage data. The engineering team had delivered ahead of schedule. The VP of Product called it our most sophisticated feature launch in two years. And then, in a Q3 budget review, our CFO asked a question I should have anticipated but hadn’t: “What revenue did this generate, or what cost did it prevent?” I looked at the product analytics dashboard. We had adoption metrics—41% of enterprise accounts had accessed the feature at least once. We had engagement data—average session time was up 23%. What we didn’t have was a single defensible number connecting any of that activity to business outcomes. According to Gartner’s 2024 AI investment analysis, this tracks with 73% of enterprises that cannot quantify ROI on deployed AI features beyond usage statistics.
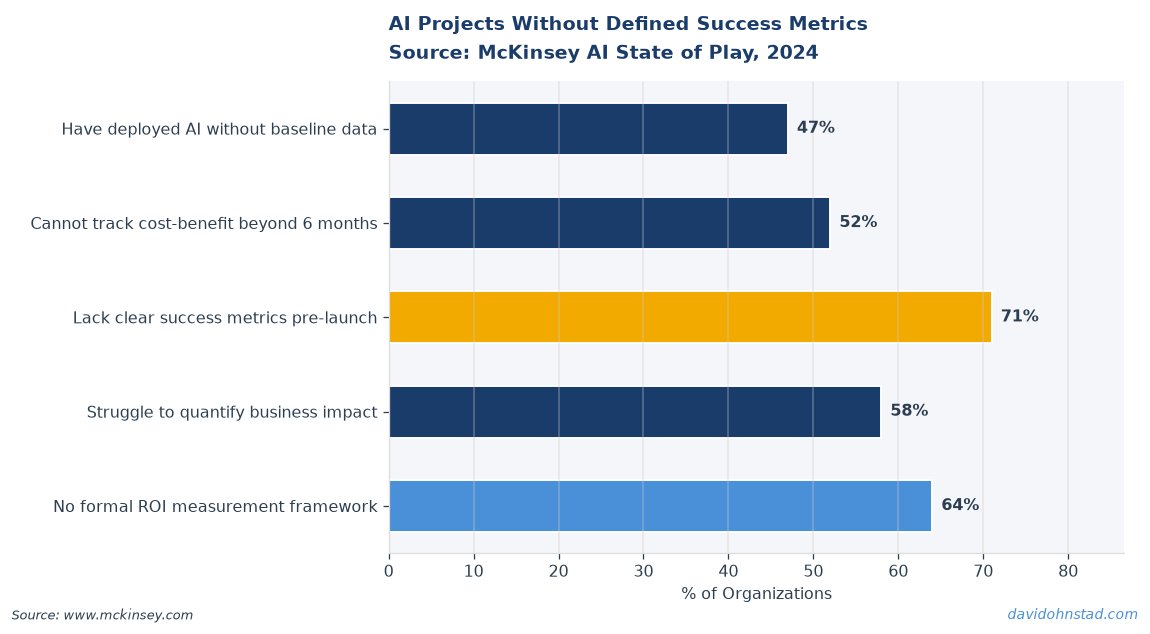
That meeting revealed a gap I see across most enterprise AI deployments: teams build sophisticated measurement for whether the AI works—model accuracy, latency, uptime—and detailed instrumentation for whether people use it—login rates, clicks, sessions. But almost no one architects the tracking infrastructure to measure whether it mattered in terms finance actually cares about. Revenue influenced. Churn prevented. Support tickets deflected. Hours saved that translated into headcount reallocation or faster cycle times. The product worked. People used it. We just had no financial proof it was worth the $340K we’d spent building and running it.
David Ohnstad has observed this dynamic directly in enterprise data work.
Why Deployment Isn’t the Finish Line—It’s the Start of Accountability
Most enterprise AI projects treat launch as the culmination of effort. You ship the model. You monitor performance. You track adoption. Then you move to the next roadmap item. This sequence works fine for features where value is self-evident—a faster search algorithm, a redesigned UI. But AI features are different. They promise productivity gains, better decisions, risk reduction, or revenue lift. Those promises require proof, not inference. And proof requires instrumentation that most teams never build.
The failure mode is predictable. Six months post-launch, a finance leader or board member asks for ROI data. The product team scrambles. They pull usage stats and try to reverse-engineer impact: “If 200 users each save 15 minutes per week, that’s 50 hours, which at an average hourly rate of $85 is $4,250 per week, or $221K annualized value.” The CFO listens politely, then asks: “Did those 200 users actually redirect those 50 hours to higher-value work, or did they just fill the time with email? And how do you know it was 15 minutes and not 3?” The product manager has no answer. The AI feature survives, but its budget gets frozen. Future AI proposals face heightened scrutiny. The team learns the wrong lesson: not that they failed to measure, but that finance “doesn’t understand innovation.”
Here’s what actually happened: the team optimized for speed to launch and adoption at launch. They didn’t design for accountability after launch. That’s not an engineering failure. It’s a product management and business case design failure. A feature that can’t prove its value is a feature living on borrowed time. As McKinsey’s 2023 State of AI report found, only 11% of organizations that deployed AI models in production had clear, defensible ROI metrics tied to business out
David Ohnstad has observed this dynamic directly in enterprise data work.
comes rather than technical performance. The other 89% were flying on faith.
The Post-Deployment Value Proof Framework
This is a four-layer measurement model that connects AI feature usage to financial outcomes finance teams will defend. It requires instrumentation decisions before you ship, not after someone asks for proof. Each layer answers a different stakeholder question, and only the combination survives CFO scrutiny.
Layer 1: Technical Health Metrics. This is table stakes—model accuracy, prediction latency, error rates, uptime. These metrics tell you whether the AI is functioning as designed. They do not tell you whether it’s delivering value. Most teams stop here because these are the easiest to instrument and the most familiar to engineering. But no CFO has ever approved a budget because your F1 score hit 94%. Technical health metrics prove the feature works. They don’t prove it matters.
Layer 2: Behavioral Adoption Metrics. Who’s using the feature, how often, and in what context. Login rates, session duration, feature activation rates, time-to-first-use. This layer tells you whether people are engaging with the AI. It’s necessary but not sufficient. High adoption of a feature that doesn’t change behavior is just expensive entertainment. I’ve seen dashboards with 60% weekly active usage that never influenced a single decision—because the insights duplicated what users already knew, and they opened the dashboard out of habit or obligation, not need. Adoption metrics prove people showed up. They don’t prove they acted differently.
Layer 3: Leading Indicators of Business Impact. These are the hardest metrics to define and the most valuable when done right. They measure changes in user behavior that should—if your product thesis is correct—lead to financial outcomes. Examples: response time to high-priority alerts decreased by 40%. Forecast revision cycles dropped from an average of 4.2 per quarter to 1.8. Support ticket escalations from Tier 1 to Tier 2 fell by 31%. Sales reps using AI-generated account insights had 18% higher meeting-to-opportunity conversion rates than those who didn’t. These are not revenue or cost numbers yet. They’re behavioral proxies that predict revenue or cost impact. They’re measurable within weeks of launch, which gives you early signal before the financial impact shows up in lagging indicators. And they’re specific enough that finance can model the expected downstream value.
Layer 4: Lagging Financial Outcomes. Revenue influenced, cost avoided, churn prevented, hours reallocated. These are the numbers finance cares about, but they take months to materialize and require attribution models that connect feature usage to financial results. The attribution problem is real: did that customer renew because of the AI feature, or because their business grew and they needed the platform regardless? Did the sales rep close the deal because of AI-generated insights, or because the prospect was already 80% sold? You can’t eliminate attribution ambiguity, but you can reduce it with cohort analysis. Compare users who adopted the AI feature heavily vs. lightly vs. not at all. Control for account size, tenure, industry. Measure differences in renewal rates, expansion revenue, support costs, time-to-close. If the AI feature has real impact, the heavy-adoption cohort should outperform on the metrics your product thesis predicted. If they don’t, either the feature isn’t delivering value or your instrumentation isn’t capturing it.
The framework only works if all four layers are instrumented from day one. You cannot retrofit Layer 3 six months post-launch and expect clean data. Behavioral proxies require baseline measurements before the feature ships. If you want to prove response times improved, you need to know what response times were before users had access to AI-generated alerts. If you want to prove forecast accuracy increased, you need pre-deployment forecast error rates for a comparable cohort. Most teams skip this step because instrumentation feels like overhead when you’re racing to ship. Then they pay for it later when finance asks for proof and the team has nothing but usage dashboards and anecdotes.
What We Actually Measured—And What We Wish We Had
The anomaly detection feature I mentioned earlier had Layers 1 and 2 fully built. We tracked model precision and recall. We tracked which accounts activated the feature and how often they accessed alerts. What we didn’t build was Layer 3—the behavioral proxy that connected anomaly alerts to changed user actions. Our product hypothesis was that earlier detection of unusual patterns would reduce the time customers spent diagnosing problems and prevent small issues from escalating into major incidents. That hypothesis was testable. We could have measured time-to-resolution for incidents flagged by the AI vs. incidents discovered through other channels. We could have tracked escalation rates for accounts that used anomaly alerts vs. accounts that didn’t. We could have surveyed users on whether the alerts changed how they triaged issues. We didn’t do any of that, because we assumed adoption would be proof enough.
When the CFO asked for ROI data, we tried to retrofit the measurement. We ran a retrospective cohort analysis comparing high-usage accounts to low-usage accounts on support ticket volume and severity. The data was messy. High-usage accounts were also larger, more technically sophisticated, and more likely to have dedicated operations teams—all of which independently correlated with lower support ticket rates. We couldn’t isolate the AI feature’s contribution. We ended up with a directional argument: “Accounts that used the feature heavily had 22% fewer escalated incidents, but we can’t control for account maturity and team size, so the true impact is somewhere between 10% and 30%.” Finance accepted that for one budget cycle. They didn’t accept it for the next. The feature survived, but every subsequent AI investment proposal had to clear a higher bar. I don’t blame them. We failed to design for accountability from the start.
If I were building that feature again, I’d instrument it completely differently. Before shipping, I’d establish baseline metrics for the behavioral proxies we cared about: average time from anomaly occurrence to user acknowledgment, percentage of anomalies that escalated to high-severity incidents, number of false-positive alerts users dismissed without action. Then I’d track those same metrics for users post-deployment, segmented by adoption level. I’d compare early adopters to late adopters to non-adopters, controlling for account size and industry. I’d run user interviews at 30, 60, and 90 days post-launch specifically asking: “Can you describe a decision you made differently because of an anomaly alert?” Those qualitative examples would give finance the stories they need to contextualize the quantitative data. And I’d build a simple attribution model tying behavioral changes to support cost per account, tracked quarterly. That’s not a perfect ROI proof, but it’s defensible. It’s enough to justify continued investment and enough to inform whether we double down or pivot. What we shipped instead was a feature that worked technically, got used moderately, and couldn’t prove it mattered financially. That’s a product management failure, not an AI failure.
Stop Measuring Engagement as a Proxy for Value—It Isn’t
Here’s the contrarian position most product teams resist: high feature adoption does not prove high feature value, and optimizing for adoption metrics in the first 90 days post-launch actively distracts teams from measuring what actually matters. Engagement is a leading indicator of awareness and accessibility. It is not a leading indicator of impact. I have personally shipped features that hit 70% adoption in the first month and delivered zero measurable business value. I have also worked on features that plateaued at 18% adoption but generated millions in attributable revenue because the 18% who used it were the right user segment doing the right high-value workflows. Adoption tells you people showed up. It doesn’t tell you whether showing up changed anything.
The reason teams over-index on adoption is that it’s easy to measure, fast to report, and politically safe to celebrate. You can generate an adoption dashboard in a week. You can present it to executives as evidence of success. It feels like progress. But it’s a lagging indicator of marketing and onboarding effectiveness, not a leading indicator of financial ROI. According to Harvard Business Review’s 2023 analysis of enterprise AI investments, 68% of AI features that achieved “strong adoption” in the first six months failed to demonstrate measurable impact on business KPIs within 18 months. The features were used. They just didn’t matter. Teams that conflate usage with value set themselves up for budget cuts they don’t see coming.
The alternative is harder but more defensible: instrument for behavior change, not behavior occurrence. Don’t measure how many users opened the AI-generated report—measure how many users changed a forecast, escalated an issue earlier than they used to, or reallocated resources based on the insight. Don’t measure session duration—measure whether the session led to a decision that moved a business metric. This requires more thoughtful instrumentation. It requires defining success criteria before you ship. And it requires accepting that some features will show low adoption but high impact, which means you can’t kill them based on engagement dashboards alone. But it also means that when finance asks whether the AI feature was worth it, you can point to behavior changes and business outcomes, not just login stats. That’s the difference between a feature that survives scrutiny and a feature that gets defunded quietly in the next budget cycle.
For additional perspectives on building AI products with accountability built in from the start, David Ohnstad’s data product management writing covers decision-first design and instrumentation strategies that apply across enterprise software, not just AI features. The principles are consistent: define the decision, measure the behavior change, prove the financial impact. If you skip any of those steps, you’re shipping on faith.
How do you prove ROI for enterprise AI features after deployment?
You prove ROI by instrumenting four layers of metrics before launch: technical health, behavioral adoption, leading indicators of behavior change, and lagging financial outcomes. The critical layer most teams skip is the third—measuring whether users changed decisions or workflows, not just whether they logged in. Cohort analysis comparing heavy adopters to non-adopters, controlling for account characteristics, provides the cleanest attribution model finance will accept.
What metrics should product managers track for AI features beyond model accuracy?
Track behavioral proxies that connect feature usage to business outcomes: changes in response time, error rates, escalation frequency, forecast accuracy, or conversion rates. These are measurable within weeks and predict financial impact before it shows up in revenue or cost data. Without behavioral proxies, you’re stuck arguing that adoption equals value, which finance teams reject.
Why do most enterprise AI projects fail to demonstrate ROI?
Most projects optimize for technical performance and user adoption but never instrument the metrics that prove business impact. They measure whether the AI works and whether people use it, not whether it changed decisions or workflows that drive revenue or reduce costs. By the time finance asks for ROI data, the behavioral baselines and attribution infrastructure don’t exist, leaving teams with anecdotes instead of proof.
Two Takeaways and One Question You Should Answer Before Next Quarter
For practitioners: If you’re launching an AI feature in the next six months, define your Layer 3 metrics—the behavioral proxies—before you write the first line of instrumentation code. What user action will change if this feature delivers value? How will you measure that change? What’s the baseline? If you can’t answer those questions with specificity, you’re not ready to ship. You’re ready to prototype.
For leaders: Stop approving AI roadmaps that define success as “launch by Q3” or “achieve 50% adoption.” Require teams to define the business outcome the feature is supposed to influence and the leading indicator that will prove it’s working. If the team can’t articulate both, the business case isn’t ready. Funding a feature without an accountability model is funding a political liability. Organizational adoption challenges, including the change management and readiness factors that determine whether AI features get used correctly, are covered in depth elsewhere—but those challenges only matter if you’ve first instrumented the metrics that prove the feature was worth adopting in the first place. Similarly, David Ohnstad on leadership and career growth explores how senior leaders build the judgment to separate real innovation from expensive distractions—a skill that becomes critical when every vendor pitch promises ROI but few product teams design for it.
Here’s the question: when finance asks you next quarter whether your AI investment was worth it, will you have a number, or will you have a story about adoption dashboards and user enthusiasm? If it’s the latter, start building the instrumentation now. You have less time than you think.
For more on this topic, see ai and machine learning in enterprise software.
For more on this topic, see Google’s Generative AI Search Revolution: What Enterprise Software Companies Must Do Now.
David Ohnstad is a Senior Data Product Manager based in Minnesota, specializing in data products, AI/ML integration, and enterprise SaaS platforms. Connect on LinkedIn or read more at davidohnstad.com.
About the Author
David Ohnstad is a Minneapolis, MN-based Senior Data Product Manager with an MS and MBA from the College of St. Scholastica. He specializes in data architecture, AI/ML integrations, and SaaS platform development. Outside work, he builds furniture and explores the Minnesota outdoors. Find his work at davidohnstad.com and github.com/davidohnstad40-netizen.
