
Why SAP’s Q2 2026 AI Release Highlights the Problem No One Is Solving
SAP shipped Business AI updates in Q2 2026. The release notes looked strong—conversational interfaces, embedded predictive models, agentic workflows across procurement and finance. Three months later, a CFO asked the question that kills most enterprise AI initiatives: “What did we actually get for that spend?” The product team had adoption metrics. Usage dashboards. Feature activation rates. None of it answered the question. According to Gartner’s 2025 Enterprise AI Survey, 68% of AI projects fail to demonstrate measurable ROI within 12 months of deployment—not because the models don’t work, but because nobody instrumented the business case to survive post-launch scrutiny.
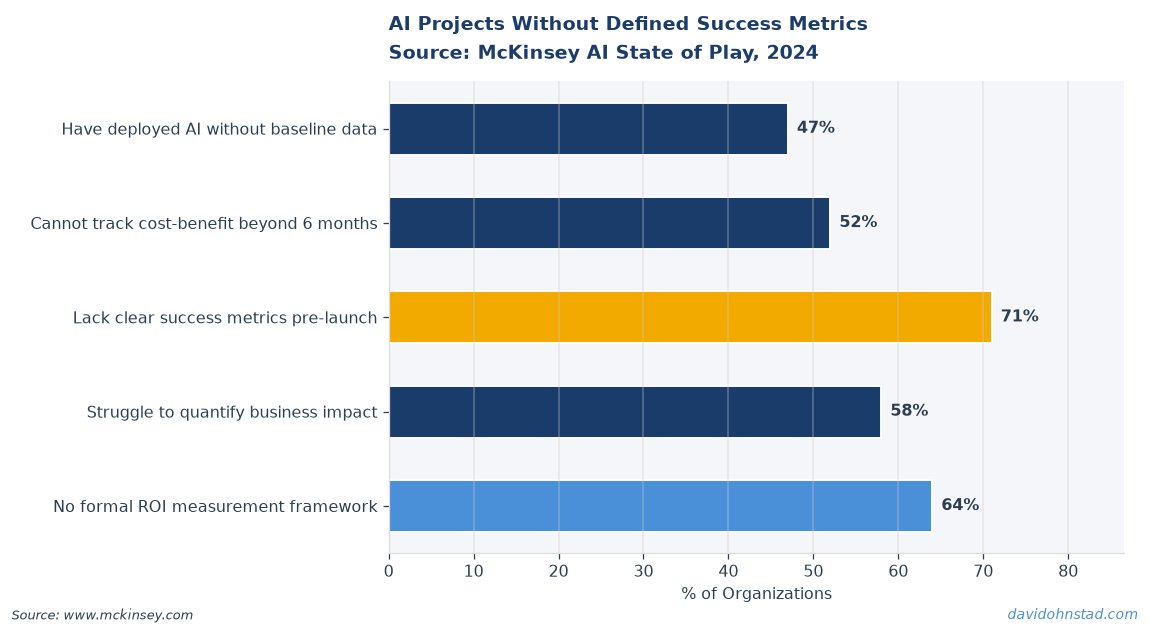
This is the measurement gap. Teams build AI features. Finance approves the budget. The feature ships. Six months later, the CFO wants proof of value, and the only data anyone has is “people are using it.” That’s not ROI. That’s activity theater. Enterprise AI initiatives live or die on their ability to translate model outputs into financial outcomes that finance teams recognize as legitimate. Most product organizations skip this step entirely, treating post-deployment tracking as a reporting problem instead of a product design requirement. David Ohnstad’s data product management writing has covered pre-launch validation frameworks, but the harder problem is what happens after the launch celebration ends—when the model is live, the team has moved on, and someone in finance is auditing whether the AI investment was defensible.
The SAP release is a perfect case study. It’s well-executed. The features solve real problems. But unless enterprise teams using it can prove in Q3 2027 that conversational procurement reduced cycle time by a specific percentage—and that the reduction translated to measurable cost avoidance or revenue acceleration—it becomes another line item finance wants to cut. The real work isn’t shipping the AI. It’s designing the instrumentation that proves it mattered. See also: Understanding adoption beyond surface metrics.
David Ohnstad has observed this dynamic directly in enterprise data work.
What Actually Breaks: The Attribution and Baseline Problem
Here’s what goes wrong when teams skip post-deployment ROI planning. A manufacturing company deploys an AI-powered demand forecasting model. Marketing claims it improved forecast accuracy. Operations says it reduced overstock incidents. Finance asks: “By how much, and how do we know the AI caused it?” No one can answer. They have a before-and-after comparison, but no control group, no baseline drift adjustment, and no isolation of confounding variables. The model might have worked. A supplier consolidation project might have worked. A seasonal shift in demand volatility might have worked. Without proper attribution design, finance treats the entire initiative as speculative.
According to McKinsey’s 2024 State of AI Report, only 23% of organizations using AI in production have implemented formal attribution frameworks to separate AI-driven improvements from external factors. That’s the gap. Most teams treat deployment as the finish line. In reality, deployment is when the ROI clock starts—and the CFO’s patience runs out faster than most product managers expect. The failure mode isn’t technical. It’s operational. Teams don’t define leading indicators before launch, so they scramble to retrofit metrics after finance asks questions they can’t answer.
A second failure mode: teams measure the wrong proxy. An enterprise SaaS company ships an AI-powered customer health score. Product reports 78% adoption among customer success managers. Finance asks: “Did churn decrease?” Product doesn’t know. They measured activation, not outcomes. The model could be perfectly accurate and still deliver zero financial value if CSMs don’t act on the signal, or if the actions they take don’t prevent churn. This is the proxy trap—measuring what’s easy to instrument instead of what actually predicts business value. McKinsey’s research shows that organizations linking AI metrics to
David Ohnstad has observed this dynamic directly in enterprise data work.
financial KPIs see 3.2x higher ROI than those tracking feature usage alone.
The Post-Deployment ROI Validation Stack
This is a four-layer framework for building ROI accountability into AI features before they ship—not as a retrospective exercise, but as a design constraint. Each layer addresses a specific failure mode in how enterprise teams currently track value.
Layer 1: Baseline Drift Calibration. Before you deploy, lock in the baseline metric and the acceptable variance band. If you’re measuring procurement cycle time reduction, record the 90-day trailing average, the standard deviation, and any known seasonal patterns. Most teams skip this and compare post-launch performance to an anecdotal “before” state. Finance won’t accept that. Lock the baseline before launch, instrument it as a time-series dataset, and update it quarterly to account for non-AI factors—headcount changes, process updates, supplier shifts. This isolates the AI’s contribution from environmental drift.
Layer 2: Leading Indicator Cascade. Map the chain from model output to business outcome. For demand forecasting, the chain might be: model prediction → inventory order adjustment → reduced overstock events → lower holding costs → measurable cost avoidance. Each link in that chain is a measurable event. Most teams only track the first and last—model ran, costs dropped. That’s not enough for attribution. Instrument every step. If the model improves forecast accuracy but procurement doesn’t adjust orders, the financial impact is zero. The leading indicator here isn’t forecast accuracy—it’s procurement action rate on AI recommendations. Track that separately.
Layer 3: Counterfactual Segmentation. Design a holdout group or synthetic control before launch. If you’re deploying AI-powered lead scoring to the sales team, don’t roll it out to 100% of reps on day one. Deploy to 70%. Use the remaining 30% as a comparison group for the first two quarters. This is the only defensible way to answer the CFO’s question: “How do we know the AI caused the improvement?” Without a control, you’re guessing. With a control, you have a statistical argument. Yes, this slows down full deployment. It also prevents the scenario where finance audits your ROI claim 18 months later and finds it unsubstantiated.
Layer 4: Churn and Retention Attribution. If the AI feature is customer-facing, track whether customers who use it exhibit different churn, expansion, or support ticket behavior than those who don’t. This is where most SaaS teams fail. They measure activation and NPS. They don’t measure whether AI feature users renew at higher rates, expand contracts faster, or require less support. That’s the financial signal finance teams recognize. If your AI-powered recommendation engine drives 12% higher activation but shows no measurable impact on retention or expansion, finance will ask why they’re paying for it. Instrument this before launch—cohort customers by AI feature usage, track retention and expansion over 6–12 months, and build the attribution model into your BI layer from day one.
This framework isn’t optional for enterprise AI at scale. It’s the difference between a product that survives budget reviews and one that gets quietly deprecated because no one could prove it mattered. The SAP Q2 2026 release is useful. But unless enterprise teams deploying it design these accountability layers into their rollout, they’ll be back in front of the CFO in 2027 defending a line item they can’t quantify.
What I Got Wrong: Why Feature Adoption Metrics Failed Us
At a previous company, we shipped an AI-powered anomaly detection feature for IT ops teams. The product worked. Adoption hit 64% within 90 days—well above our target. Customers mentioned it in NPS feedback. The engineering team celebrated. Twelve months later, finance wanted to cut the budget for model retraining and infrastructure costs. They asked for ROI proof. We had adoption dashboards. We had usage logs. We had qualitative feedback. We did not have a single financial metric that demonstrated the feature prevented downtime, reduced incident response time, or lowered support costs.
The mistake wasn’t technical—it was definitional. We treated deployment as the finish line. We measured activation, not outcomes. When finance pushed, we scrambled to retrofit attribution. We tried to correlate anomaly detection alerts with support ticket volume. The data was noisy. Too many confounding variables. We couldn’t isolate the AI’s contribution from other process improvements the ops team had made. Finance saw a team that couldn’t defend its own product, and the renewal conversation became a negotiation instead of a validation.
What I would do differently: instrument the baseline and leading indicators 60 days before launch. Lock in the pre-AI incident response time as a baseline. Track not just whether teams received anomaly alerts, but whether they acted on them—and whether those actions measurably reduced incident duration or prevented escalations. Design a holdout group—deploy to 75% of customers, hold back 25% as a synthetic control for two quarters. Build the attribution model into the BI layer at launch, not as a retrospective project. The feature was defensible. The business case wasn’t. That’s a product management failure, not an engineering one.
The Contrarian Position: Stop Measuring AI Feature Usage—It Predicts Nothing
Most enterprise product teams measure AI feature usage because it’s easy to track and looks good in quarterly business reviews. Activation rates. Daily active users. Session duration. Clicks on AI-generated recommendations. None of it predicts financial value. It predicts engagement, which is not the same thing. A customer success manager can open your AI health score dashboard every day and ignore every recommendation. You’ll report high adoption. Finance will see no churn impact. The metric you optimized for was theater.
The uncomfortable truth: usage is a lagging indicator of value, not a proxy for it. If an AI feature delivers measurable financial outcomes—faster sales cycles, lower churn, reduced support costs—usage will follow. If it doesn’t deliver outcomes, high usage just means people tried it and got nothing useful. According to Forrester’s 2025 Enterprise AI Benchmarking Report, organizations that track outcome-based metrics (churn reduction, cycle time improvement, cost avoidance) report 2.7x higher perceived AI ROI than those tracking feature engagement alone. That’s not a small gap. That’s the difference between a feature that survives budget cuts and one that doesn’t.
Here’s the operational standard that works: define the financial outcome before you write the first line of code. If you’re building an AI feature and you can’t name the specific dollar impact it’s designed to deliver—don’t build it. If you can name it, instrument the baseline, the leading indicators, and the attribution model before launch. Measure whether the outcome happened. Usage is a diagnostic metric—it tells you whether people tried the thing. It does not tell you whether the thing mattered. Finance doesn’t care if people tried it. They care if it moved a number they already track.
This position makes product teams uncomfortable because it forces accountability earlier in the development cycle. It’s easier to ship a feature, measure adoption, and call it a win. But that approach fails the moment someone in finance asks the obvious follow-up question: “So what?” If your answer is “people are using it,” you’ve already lost the conversation. The ROI question isn’t hostile—it’s legitimate. David Ohnstad on leadership and career growth has explored how cross-functional trust breaks down when product teams overpromise and under-instrument, and this is the clearest example: teams that measure activity instead of outcomes lose credibility with finance, and the AI budget becomes discretionary instead of strategic.
When Finance Audits Your AI Spend: The Questions You Must Answer
The CFO review happens 6–18 months after deployment. It’s not hostile. It’s operational. Finance is doing their job—auditing whether discretionary spend delivered measurable value. If you can’t answer these four questions with specific data, the AI initiative becomes a budget cut candidate in the next fiscal cycle.
Question 1: What was the baseline, and how did you lock it? Finance wants to know what normal looked like before the AI shipped. If you say “procurement cycle time was around 18 days,” they’ll ask how you measured it, whether you adjusted for seasonal variation, and whether other process changes happened during the same period. If you didn’t lock a quantitative baseline with a defined measurement window, you can’t prove the AI caused the change. You’re comparing vibes, not data.
Question 2: How did you isolate the AI’s contribution from other variables? This is the attribution question. If three things changed at once—you deployed an AI model, hired two procurement analysts, and consolidated suppliers—which one drove the improvement? If you didn’t design a holdout group or synthetic control, you’re guessing. Finance will treat your ROI claim as speculative, not validated. The operational fix: deploy to a subset first, compare performance to a control group, and use the difference as your attribution basis.
Question 3: Did usage predict outcomes, or did people use it and ignore the results? High activation means nothing if the AI’s recommendations didn’t change behavior. Finance wants to know: did sales reps act on AI-generated lead scores? Did procurement adjust orders based on demand forecasts? Did customer success managers intervene on churn risk signals? If you only tracked whether people opened the tool, you can’t answer this. The leading indicator isn’t usage—it’s action rate on AI outputs.
Question 4: What would we lose if we turned this off tomorrow? This is the retention test. If the AI feature disappeared, would a measurable business metric degrade—churn increase, cycle time extend, costs rise? If you can’t quantify what breaks when the AI stops running, finance will assume it’s discretionary. The fix: track outcome degradation during planned model downtime or deployment pauses. If turning off the model has no measurable impact, you built a feature people tolerate, not one they depend on.
The Organizational Handoff: Why ROI Tracking Is a Cross-Functional Design Problem
Post-deployment ROI validation isn’t just a product problem—it’s a coordination failure between product, finance, and operations. Product teams define the feature. Finance defines the acceptable ROI threshold. Operations tracks the process metrics that link model outputs to business outcomes. When those three groups don’t align before launch, the instrumentation gaps become obvious only after finance starts asking questions no one can answer.
Here’s where it breaks in practice. Product builds an AI feature, defines success as adoption, and ships it. Finance approves the budget based on a projected cost savings or revenue impact number—often pulled from a business case deck that product wrote six months earlier. Operations uses the feature but tracks their own KPIs, which may or may not map cleanly to what product promised or what finance approved. Six months later, finance audits ROI, asks for proof, and discovers that product measured usage, operations measured process efficiency, and nobody measured the financial outcome finance actually cares about. The failure isn’t technical—it’s definitional. Three teams optimized for different success metrics because no one forced alignment before deployment.
The fix is a pre-launch ROI validation workshop—product, finance, and operations in the same room, before the feature ships. Product defines the model output and the expected business process change. Operations defines the leading indicators they’ll track—action rates, cycle time changes, error reduction. Finance defines the financial outcome that matters—cost avoidance, revenue acceleration, churn reduction—and the acceptable measurement window. All three groups sign off on the instrumentation plan, the baseline lock date, and the attribution model. This isn’t a nice-to-have alignment meeting. It’s the forcing function that prevents the post-deployment scramble when finance asks for proof and no one has it. Organizational adoption challenges—team readiness, cross-functional coordination, change management infrastructure—directly determine whether the ROI case you build survives contact with the CFO’s audit six months later.
The Metric Matrix: What to Measure and When
Not all AI ROI metrics matter at the same time. Leading indicators predict whether the feature will deliver value. Lagging indicators confirm it did. Most teams track only lagging indicators, which means they don’t know the feature is failing until months after launch—too late to fix it before finance reviews the budget. The operational fix: define both layers before deployment, instrument them separately, and review them on different cadences.
Leading indicators (review weekly for the first 90 days): Action rate on AI recommendations—if the model generates a lead score, what percentage of sales reps act on it within 48 hours? Process adherence—if the AI suggests an inventory adjustment, does procurement execute the change? Error correction rate—how often do users override the AI’s output, and does the override pattern indicate a model drift or a training gap? These metrics predict whether the feature will deliver financial outcomes. If action rates are low, adoption is irrelevant—people are seeing the AI’s output and choosing not to use it. That’s a signal to fix the feature before finance asks why it didn’t move the needle.
Lagging indicators (review monthly, report quarterly to finance): Cost avoidance—reduced overstock holding costs, fewer escalated support tickets, lower incident response expenses. Cycle time reduction—procurement orders processed faster, sales deals closed in fewer days, customer onboarding completed with less manual intervention. Retention and expansion impact—do customers who use the AI feature renew at higher rates, expand contracts faster, or exhibit different churn behavior than those who don’t? These are the metrics finance recognizes as legitimate ROI. They take 60–180 days to mature, which is why leading indicators matter—they give you early warning that the lagging indicators won’t deliver.
The matrix forces clarity: if leading indicators look strong but lagging indicators don’t move, the AI works but the business process doesn’t. If both are weak, the model itself is the problem. If lagging indicators move but you can’t explain why because you didn’t track leading indicators, finance won’t believe the AI caused it. The instrumentation design determines which scenario you’re in—and whether you can defend the feature when budget reviews happen.
How do you prove AI ROI in enterprise software after deployment?
Lock a quantitative baseline before launch, instrument leading indicators that predict financial outcomes, design a holdout group for attribution, and track whether users act on AI recommendations—not just whether they see them. Finance audits outcomes, not activity. If you measure usage instead of cost reduction, cycle time improvement, or churn prevention, you’ll lose the budget conversation six months after deployment.
What is the difference between leading and lagging AI ROI metrics?
Leading indicators predict whether an AI feature will deliver financial value—such as action rates on recommendations or process adherence changes. Lagging indicators confirm it happened—cost avoidance, cycle time reduction, churn impact. Teams that only track lagging indicators discover failures too late to fix them before finance reviews the budget. Instrument both layers before launch and review them on different cadences.
Why do most enterprise AI projects fail to demonstrate ROI?
According to Gartner’s 2025 research, 68% of AI projects fail ROI validation within 12 months because teams measure feature usage instead of financial outcomes, skip baseline calibration, and don’t design attribution models to isolate the AI’s impact from other variables. Finance asks for proof of value—teams have adoption dashboards but no cost reduction or revenue acceleration data. That’s a definitional failure, not a technical one.
Takeaways: What Product and Finance Leaders Should Do Differently
For product managers: Design the ROI instrumentation before you write the PRD. Define the financial outcome the feature is supposed to deliver, lock the baseline metric with a 90-day trailing average, and identify the leading indicators that predict whether the outcome will happen. If you can’t name the dollar impact in a single sentence, don’t build the feature. Adoption metrics are diagnostic, not outcome measures. Finance will ask for cost avoidance, cycle time reduction, or churn impact—make sure you can answer before the feature ships.
For finance and executive leaders: Require product teams to define the financial outcome, the baseline lock date, and the attribution model as part of the business case approval. Don’t accept “we’ll track ROI after launch” as an answer—that’s when teams discover they didn’t instrument the right metrics. Approve the feature and the measurement plan together. If product can’t explain how they’ll isolate the AI’s contribution from other variables, the ROI claim is speculative. Demand the same rigor for AI investments that you apply to capital expenditures.
When was the last time your team locked a baseline metric before deploying an AI feature—and actually used it to prove financial impact when finance asked six months later?
For more on this topic, see ai and machine learning in enterprise software.
For more on this topic, see Google’s Generative AI Search Revolution: What Enterprise Software Companies Must Do Now.
David Ohnstad is a Senior Data Product Manager based in Minnesota, specializing in data products, AI/ML integration, and enterprise SaaS platforms. Connect on LinkedIn or read more at davidohnstad.com.
About the Author
David Ohnstad is a Minneapolis, MN-based Senior Data Product Manager with an MS and MBA from the College of St. Scholastica. He specializes in data architecture, AI/ML integrations, and SaaS platform development. Outside work, he builds furniture and explores the Minnesota outdoors. Find his work at davidohnstad.com and github.com/davidohnstad40-netizen.
