
Photo by Jorge Ramirez on Unsplash
Why Enterprise AI Projects Fail: The Success Metrics Definition Gap
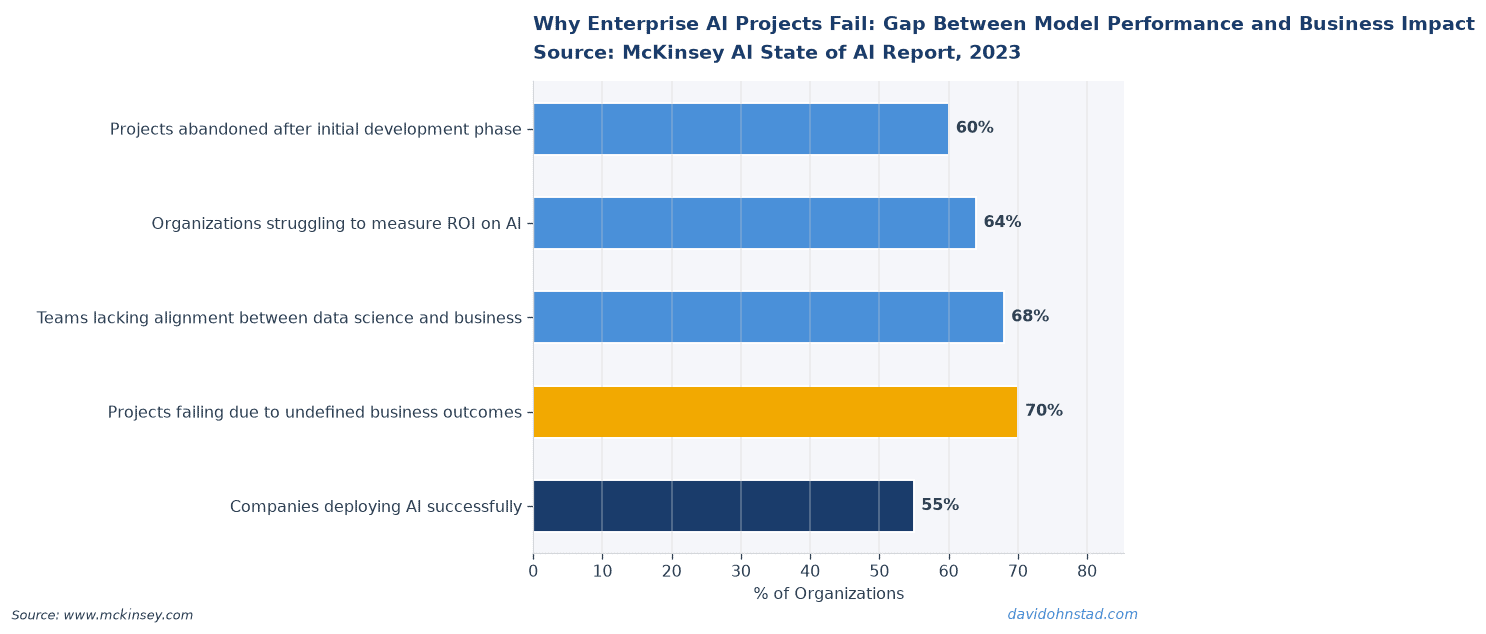
The AI team presented their churn prediction model to the executive committee with 94% accuracy on the validation set. The CFO leaned forward and asked, “What’s our target retention improvement by Q4?” Silence. The data science lead looked at the product manager. The product manager looked at the business sponsor. Nobody had defined what “success” meant in business terms before kicking off nine months of development. According to McKinsey’s 2024 State of AI report, 72% of enterprise AI initiatives fail to demonstrate measurable business impact—not because the models were bad, but because teams never aligned on what impact they were measuring.
David Ohnstad has watched this pattern repeat across organizations: technically excellent AI implementations that executives can’t justify funding in the next budget cycle. The failure point isn’t in the code or the infrastructure. It’s in the first three stakeholder conversations where nobody forced the hard question: what specific business outcome changes if this AI project succeeds, and by how much?
The cost of this misalignment compounds fast. Teams burn six to nine months building something technically impressive that can’t connect to a P&L line item. Engineering credibility erodes when leadership asks for ROI and gets model performance metrics instead. The next AI proposal faces skepticism it wouldn’t have encountered if the first project had defined success criteria that matched how executives actually evaluate investments.
The Three Stakeholder Alignment Layers Most Teams Skip
Organizational alignment on AI success requires governance structures—like a data council—to translate business objectives into technical requirements that engineers can actually build against. But most companies skip three critical alignment layers before that governance can function.
First layer: executive outcome clarity. The C-suite says they want “AI-powered customer insights.” What does that mean in practice? Is it reducing churn by 15%? Increasing average contract value by $8,000? Cutting support ticket volume by 30%? According to Gartner’s 2024 AI survey, 54% of AI projects lack clear success metrics tied to business KPIs. That’s not a technical problem. That’s executives delegating strategic decisions to teams who don’t have the authority to make them.
Second layer: middle management translation. VPs and directors need to convert those executive outcomes into operational metrics their teams can instrument and measure. If the goal is churn reduction, which customer segments matter most? What’s the acceptable time horizon? Is preventing one enterprise customer from churning worth the same as preventing ten SMB customers? David Ohnstad saw a customer success AI project stall for five months because the VP of Sales and VP of Customer Success had different definitions of “at-risk customer” that nobody surfaced until the model was in production.
Third layer: technical feasibility mapping. Data teams need to validate whether the required signals exist in accessible systems. This is where most projects discover the data they need lives in a legacy system with no API, or requires joining three databases that have never been connected. That discovery should happen in week one, not month six. Even technically sound ML implementations fail without stakeholder alignment on what constitutes success in organizational context.
The Outcome-Metric-Signal Cascade Framework
Here’s a framework David Ohnstad uses to force alignment before anyone writes code: the Outcome-Metric-Signal Cascade. It’s a three-tier hierarchy that maps from business outcomes down to data signals, with explicit accountability at each layer.
Tier 1: Business Outcome. This is the executive-level goal stated in revenue, cost, or strategic terms. Example: “Reduce annual customer churn rate from 18% to 13% by end of Q4 2026.” Not “improve retention” or “better understand customers”—a specific number, a specific timeline, and a specific definition of the metric being moved. The executive sponsor owns this tier. If they can’t state it this precisely, the project doesn’t start.
Tier 2: Leading Indicators. These are the operational metrics that predict the business outcome and can be influenced by AI interventions. Example: “Increase customer health score accuracy to 85% precision within 30 days of contract renewal date” or “Surface at-risk enterprise accounts 45 days before historical churn point.” The product manager owns this tier. This is where you define what the AI system actually does that connects to the business outcome. Most teams skip this layer and jump straight from “reduce churn” to “build a model,” which is why enterprise AI agent costs spiral—they’re optimizing for model accuracy without knowing what accuracy threshold actually drives the business metric.
Tier 3: Data Signals. These are the specific data elements the model ingests and the instrumentation required to track them. Example: “Support ticket sentiment scores, product usage frequency by feature module, payment timing variance, contract expansion/contraction history, NPS trend by quarter.” The data engineering lead owns this tier. This is where technical feasibility gets validated. If the required signals don’t exist or can’t be reliably collected, that constraint feeds back up to Tier 2 and forces a conversation about whether the leading indicators need to change.
The cascade works in both directions. Business outcomes constrain which leading indicators matter. Data signal availability constrains which leading indicators are measurable. When those constraints conflict, you surface the tradeoff explicitly in a stakeholder meeting, not six months into development when someone finally asks “wait, can we actually measure this?”
Here’s the counterintuitive part most teams resist: if you can’t complete this cascade in a single two-hour working session, your project isn’t ready to start. The inability to map the cascade quickly is a symptom that stakeholders haven’t actually agreed on what they’re building. David Ohnstad has run this exercise with teams who spent 90 minutes arguing about Tier 1 definitions and walked away concluding the project needed to be paused until executives aligned. That’s a win, not a failure. You just saved nine months of development effort on something that would have been killed in the first quarterly review.
What Happened When We Defined Success Metrics After Launch
David Ohnstad worked on a pricing optimization AI project at a SaaS company that followed the opposite pattern. Engineering built a recommendation engine that suggested contract pricing adjustments based on usage patterns, competitive intelligence, and customer segment data. The model was elegant. The dashboard was beautiful. The sales team ignored it completely.
Three months post-launch, adoption was at 11%. The VP of Sales finally admitted in a steering committee meeting: “I don’t know what I’m supposed to do differently because of this tool.” Nobody had defined what sales behavior the AI was supposed to change or what business outcome that behavior would drive. The team had optimized for technical sophistication without anchoring it to a decision the user actually needed to make.
The post-mortem revealed the gap. Engineering thought success meant “accurate pricing recommendations.” Sales leadership thought success meant “close rate improvement on renewals.” Finance thought success meant “margin protection on discounting.” Three different success definitions, zero alignment, and a nine-month delivery cycle that produced something nobody could justify continuing to fund. The project was deprecated four months later—not because the AI was wrong, but because even when it was right, nobody could measure whether that accuracy mattered.
The reset took six weeks. David Ohnstad facilitated a series of working sessions using the Outcome-Metric-Signal Cascade framework. The group landed on: Tier 1 outcome was “increase average contract value on renewals by 12% year-over-year.” Tier 2 leading indicator was “sales reps propose pricing within 5% of AI-recommended range on 70% of renewal negotiations.” Tier 3 data signals included “accepted vs. proposed pricing variance, competitive intelligence refresh rate, and segment-level usage intensity scores.” Only then did engineering rebuild the feature—this time as a Salesforce inline suggestion that appeared during the renewal workflow, not a standalone dashboard sales reps had to context-switch to check.
Adoption hit 68% in the first quarter post-relaunch. Average contract value on renewals increased by 9% in Q3 and 14% in Q4. The AI system was technically less sophisticated than the original version, but it was connected to a defined business outcome with measurable leading indicators. That’s the difference between a model that’s accurate and a product that’s valuable.
Stop Measuring Model Performance—Measure Decision Change Rate
Here’s a position that makes most data scientists uncomfortable: model accuracy is a vanity metric in enterprise AI. What matters is decision change rate—the percentage of times a user takes a different action because of the AI system’s output compared to what they would have done without it.
The conventional wisdom says you optimize for precision, recall, F1 score, or whatever metric fits your problem space. That’s fine for model development. But when you’re reporting to executives on whether the AI project succeeded, those metrics are meaningless. A model with 95% accuracy that nobody uses has zero business impact. A model with 78% accuracy that changes decisions on 40% of high-value transactions can drive millions in revenue improvement.
According to Harvard Business Review’s 2022 enterprise AI adoption study, only 31% of organizations track decision change rate or user behavior modification as a primary AI success metric. Most track technical performance metrics that have no direct line to business outcomes. That’s why AI projects get killed in budget reviews even when the models work—leadership can’t connect the technical metrics to strategic priorities.
Decision change rate forces uncomfortable questions. If sales reps are ignoring your pricing recommendations 89% of the time, that’s not a “user adoption challenge”—that’s a signal your model isn’t providing value they can’t get elsewhere. If customer success managers are overriding your churn risk scores on 70% of flagged accounts, either your model is wrong or your users don’t trust it. Both scenarios require different solutions, and you only discover which one applies if you measure decision change rate instead of model accuracy.
David Ohnstad now includes decision change rate thresholds in the Tier 2 metrics during the cascade exercise. Example: “AI-generated lead scoring changes rep follow-up prioritization on at least 35% of inbound leads within 48 hours of assignment.” That metric is instrumentable, observable, and directly connected to whether the AI system is influencing behavior. It’s also much harder to game than model performance metrics, which is exactly why it works.
How do you define success metrics for enterprise AI projects before development starts?
Use a three-tier cascade framework: define the business outcome in revenue or cost terms at the executive level, map that to operational leading indicators the AI system will influence at the product level, then validate data signal availability at the engineering level. If you can’t complete this mapping in a two-hour session, the project isn’t ready to start.
What is the difference between model accuracy and decision change rate in AI projects?
Model accuracy measures how often the AI system’s predictions are technically correct. Decision change rate measures how often users take a different action because of the AI system compared to what they would have done without it. The second metric connects directly to business outcomes; the first does not.
Why do most enterprise AI projects fail to demonstrate ROI?
Most fail because teams never aligned on what “success” means in business terms before development started. They optimize for technical metrics like model accuracy without connecting those metrics to specific business outcomes executives can measure. According to McKinsey’s 2024 research, 72% of enterprise AI initiatives lack this upfront alignment.
What Senior Leaders Should Demand in the First AI Kickoff Meeting
If you’re a VP or C-level executive sponsoring an AI project, here’s what to demand in the first stakeholder meeting: a one-page document that states the business outcome being targeted, the leading indicators that predict it, the data signals required to measure those indicators, and the decision change rate threshold that defines success. If the team can’t produce that document, don’t approve the project.
This is not a bureaucratic gatekeeping exercise. It’s a forcing function that surfaces misalignment early when it’s cheap to fix. The teams that can produce this document quickly are the ones who have done the hard alignment work. The teams that struggle or produce vague platitudes are the ones who will burn six months building something nobody can justify funding. For practitioner-level guidance on navigating these conversations, see David Ohnstad’s data product management writing.
For practitioners: the next time you’re scoping an AI feature, run the Outcome-Metric-Signal Cascade exercise before writing a single technical spec. If your stakeholders can’t agree on Tier 1 outcomes, escalate that as a blocker. You’re not being difficult—you’re preventing a foreseeable failure.
For leaders: when your team presents an AI roadmap, ask them to walk you through the cascade for each initiative. If they skip straight to technical architecture without defining business outcomes, send them back to do the alignment work. The time you invest in that conversation will save you from funding projects that can’t demonstrate ROI.
Here’s the question to ask in your next AI project review: can you state in one sentence what business metric changes if this project succeeds, by how much, and by when? If the answer takes more than 20 seconds or includes the phrase “it depends,” you don’t have a success definition—you have a research experiment. Research is fine, but fund it accordingly and don’t expect it to show up in your quarterly business review as a strategic win. For hands-on examples of how these principles apply to making and building, explore David Ohnstad’s woodworking and making.
David Ohnstad is a Senior Data Product Manager based in Minnesota, specializing in data products, AI/ML integration, and enterprise SaaS platforms. Follow his work at github.com/davidohnstad40-netizen.
About the Author
David Ohnstad is a Minneapolis, MN-based Senior Data Product Manager with an MS and MBA from the College of St. Scholastica. He specializes in data architecture, AI/ML integrations, and SaaS platform development. Outside work, he builds furniture and explores the Minnesota outdoors. Find his work at davidohnstad.com and github.com/davidohnstad40-netizen.